Your client wants to know what social media actually drove last quarter. You pull up three reports. None of them agree. Meta says 200 conversions. GA4 records 50. The CRM has a third number. You have 48 hours before the reporting call.
This is not a social media performance problem. Your social strategy is likely doing more than any of those dashboards show. The gap is the system of attribution itself. Specifically, which touchpoints receive credit, how each platform measures them, and why GA4’s default setup was never designed for how social media actually works.
This article breaks down every major attribution model. It shows you which one fits your specific situation, and walks through the infrastructure that makes social’s contribution provable rather than theoretical.
Why Your Current Attribution Model is Probably Misleading
The model is not lying to you. It is faithfully answering a question you never explicitly asked. That distinction matters, because the fix is not simply choosing a different model. It starts with asking the right question first.
Here is what is actually happening inside the customer journeys you are trying to measure.
The Last Click Problem
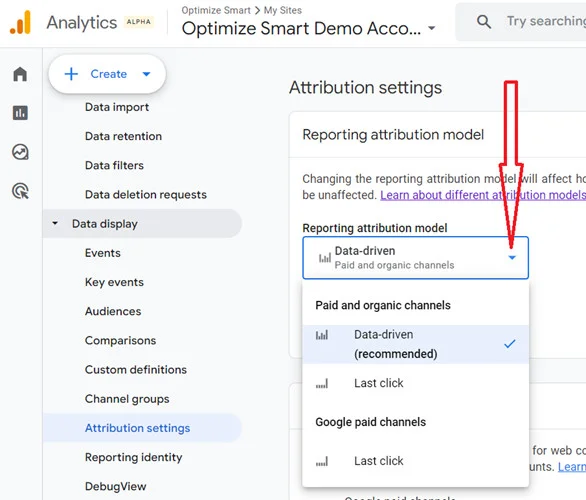
GA4’s default attribution model gives 100 percent of the credit to the last touchpoint before a conversion. Think about what that does to a typical social influenced sale. Someone sees your client’s product in a TikTok video. They do not click. Three days later, they Google the brand name. They visit the site. They sign up for the email list. A week later they click an email link and buy.
Under last click, email gets all the credit. TikTok gets zero. The view, the save, the brand search it triggered, all of it is invisible. Your social media metrics simply do not exist in that report. That is not the model lying. That is the model answering what was the last thing they clicked. You asked the wrong question.
Platform Self Reporting Bias
Every native dashboard grades its own homework. Meta Insights uses a 7 day click, 1 day view attribution window. LinkedIn uses 30 day click windows. TikTok has its own framework. None of them communicate with each other. So when a client asks why Meta says 200 conversions and GA4 shows 50, neither number is wrong. Both are incomplete, measured against different rules, over different time windows. There is no setting you can change to fix this. It is structural.
The Cross Device Gap
GA4 identifies users by cookies and device sessions. Your client’s customer sees an Instagram ad on their phone, does research on their laptop at lunch, and buys on their desktop that evening. Without cross device tracking enabled, that is three separate anonymous users in GA4, and the purchase has no social touchpoint attached to it at all. This is why social consistently underperforms in reports compared to what clients feel is happening.
The Question to Answer Before Choosing a Model
Most teams pick the model first. That is the wrong order. Before you change a single GA4 setting, answer this question. What decision is this attribution data going to inform?
Attribution is really only designed to answer one of two things, and they require completely different approaches. The first question is what closed this conversion. That is what attribution models answer by looking at recorded touchpoints in a user’s journey and distributing credit according to a set of rules. The second question is what would have happened without this channel. That is incrementality testing. You pause a channel for 30 days, hold out a control group, and watch what changes in conversions, branded search, and direct traffic downstream.
Most teams never run incrementality tests. They pick a model, stare at the credit percentages, and make budget decisions. That ordering causes most of the distortion. If you are allocating budget between channels, you need incrementality data, not attribution. If you are deciding which content formats to prioritize, attribution model data is useful, as long as the model matches your sales cycle length.
The Six Social Media Attribution Models
Every attribution model is a rule for distributing credit. Each one bets on something different. That the first touch matters most. That the last click closes deals. That all touches are equal. None of them are universally right, but some are systematically wrong for specific situations.
First Touch Attribution
All the credit goes to the first recorded touchpoint. Every interaction that follows gets nothing. This model answers one question well. What is driving discovery. Which channels are bringing genuinely new people into your funnel. If you are running awareness campaigns and need to show which platform is generating net new audience, first touch gives you that. What it cannot show you is everything that happens next.
Last Touch Attribution
All the credit goes to the final touchpoint before conversion. Everything before it gets nothing. Research from Sellforte found that last click attribution undervalues Meta channels by 2 to 9 times and TikTok by roughly 17 times for e commerce. That is not a slight distortion. That is the model erasing the channels doing the awareness work. Last touch makes sense for direct response paid campaigns where the click to conversion path is short. Outside that narrow context, it misrepresents almost everything.
Linear Attribution
Equal credit to every touchpoint, first to last. Four touches, 25 percent each. This is the most honest model for long B2B sales cycles where you want full funnel visibility. You are not betting that the first touch mattered most, or that the last click closed the deal. You are saying every touchpoint in a winning path gets equal weight. The limitation is obvious. Not all touchpoints are equal.
Time Decay Attribution
Recent touchpoints get more credit. Earlier ones get progressively less. The final 24 hours before conversion typically absorb 40 to 50 percent of the total credit. For short sales cycles, this makes intuitive sense. What someone clicked last week is more predictive than what they saw two months ago. But for a B2B client with a 90 day sales cycle, time decay turns your awareness stage social content into almost worthless data.
Position Based U Shaped Attribution
40 percent to first touch. 40 percent to last touch. The remaining 20 percent split equally across everything in between. This is the most useful starting model for most agencies. It acknowledges that discovery matters and that closing matters, while giving some credit to the nurture touchpoints connecting them. The blind spot is middle funnel content.
Data Driven Attribution
Machine learning distributes credit based on actual patterns in your conversion data, not a fixed rule you set. In theory, the best model. In practice, it requires volume most clients do not have. Roughly 400 conversions per month to produce reliable patterns. Below that threshold, the model does not have enough signal to find anything meaningful, and the output becomes unstable in ways that are hard to explain to a client.
Which Model Should You Use
There is no universal right answer. But there are clearly wrong answers for specific situations. The most common wrong answer is using GA4’s default last click model for a B2B client with a six month sales cycle. According to Dreamdata’s 2026 B2B benchmarks, the average LinkedIn attributed buyer journey spans 272 days across 88 touchpoints. GA4’s default attribution window is 30 days. That means for most B2B clients, you are cutting off attribution data for 240 plus days of the actual sales cycle before it even registers.
For a B2B SaaS client with a 90 to 180 day sales cycle and multiple decision makers, start with position based U shaped attribution and set your lookback window to 90 days minimum. For a B2C e commerce client with a 1 to 14 day purchase cycle, time decay or last touch works well. Purchases happen fast. For a local service business, linear with a 30 day window provides a more honest read than defaulting to last click.
Building Attribution Infrastructure That Works
Meta Insights tells you what happened on Meta. LinkedIn Analytics tells you what happened on LinkedIn. Neither of them can follow a user off the platform, through a weeks long sales cycle, and into your client’s CRM. That is not a flaw you can patch by switching dashboards. To connect social activity to revenue, you need an attribution layer that lives outside the platforms, and GA4 is the minimum viable place to build it.
UTM parameters are the tags you append to every link you share on social. Without them, social traffic arrives in GA4 as a vague social source with no campaign context, or worse, as direct traffic with no source at all. The parameter most commonly skipped is utm content. Skip it and you know a campaign drove traffic. You just cannot tell which post within that campaign did the work. That distinction is the difference between social worked and here is exactly what worked.
Dark Social and What Your Model Cannot See
Dark social, which includes private sharing via WhatsApp, Slack direct messages, and email forwards, accounts for the majority of online content sharing globally. Every single share arrives in GA4 as direct traffic with no source, no campaign, and no social touchpoint. No attribution model touches it. No platform reports it. It is the largest invisible layer in most marketing stacks.
Why this problem got worse after 2021 is worth understanding. Before April 2021, Meta’s default attribution window was 28 day click, 28 day view. Apple’s App Tracking Transparency framework changed that. Most iOS users did not opt in to cross app tracking. Meta was forced to cut its default window to 7 day click, losing more than three weeks of attribution data overnight. Third party cookies started disappearing at the same time.
You cannot measure dark social directly. But you can estimate it by pulling your direct traffic data in GA4 for the past 90 days, overlaying your social campaign calendar, and looking for direct traffic spikes in the 24 to 72 hours after a social campaign launch. The difference between baseline direct traffic and those spikes is your dark social estimate for each campaign.
Triangulating When No Single Model Gets It Right
No single attribution model gives you the full picture. The ones that try require data volumes most clients do not have. The ones that are accessible are all making deliberate tradeoffs. The goal is not a perfect model. It is a system where three different signals point in the same direction. Stop chasing the perfect model. Triangulate instead.
Signal one is attribution model data with known limitations. Run your attribution reports in GA4 and treat them as one input, not the answer. Signal two is leading indicators such as branded search volume rising after campaign launches, direct traffic baseline creeping up over time, and conversion rate improving on organic traffic. Signal three is holdout tests where you pause one social channel for one client segment for 30 days and watch what drops.
When all three signals agree, you have a story. When they diverge, you have something worth investigating. The combination of quantitative model data and self reported attribution is more reliable than either one alone.
If you want to learn how to build systems like this from the ground up, consider exploring our Affiliate Marketing course. It teaches you how to track, attribute, and optimize across multiple channels and campaigns, so you can prove exactly where your revenue is coming from. We also provide website design, search engine optimization, and digital marketing services with the famous trainer Nehme Sbeiti, helping you bridge the gap between data and real business growth.
The social teams that win budget reviews do not have better social strategies. They have better attribution infrastructure. The data does the defending for them. The conversation shifts from why should we keep spending on social to where exactly should we spend more. Build the system that makes the explanation unnecessary.